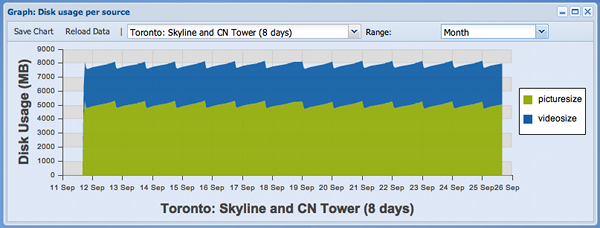
This window display disk usage evolution of a source over time. You can see both picture usage and video usage on this graph, with pictures in green and videos in blue. Global usage corresponds to the top of the blue line (here around 8GB).
If you click on the legend you can display only pictures, only videos or both.
The above capture is very interesting, as you can see automated picture deletion is activated and only 8 days of capture are kept by the system. You can see a disk usage increase during the day, with old pictures being deleted each morning, corresponding to the drop you can see on the graph.
As you can see, disk usage always remains around 8GB.
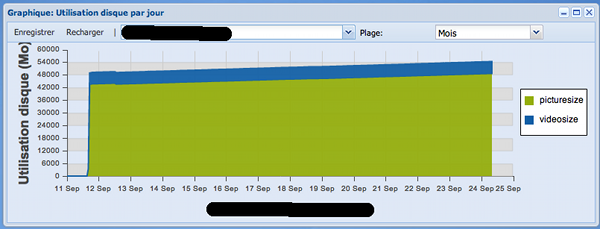
The above graph is the most usual scenario, with disk usage constantly increasing as time pass by, on this graph you can see disk usage going from 48GB to 54GB in around 10 days.